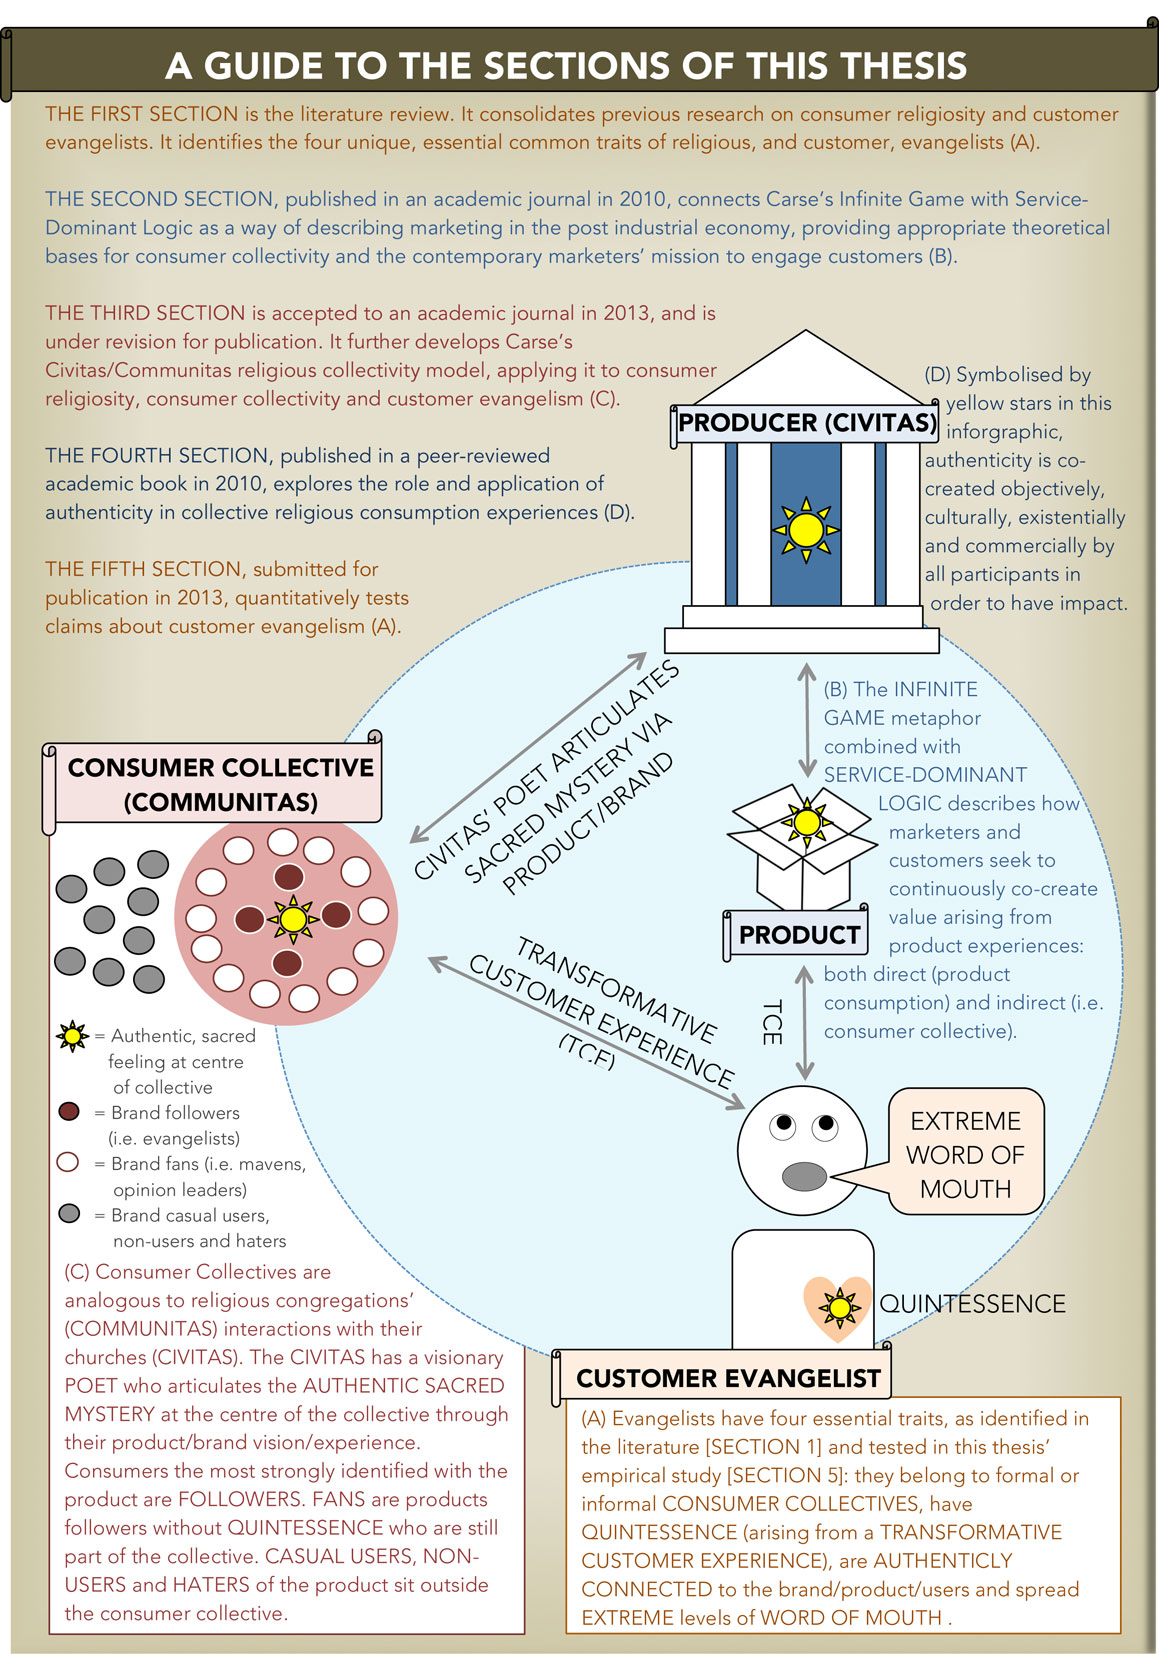
I am currently completing (hopefully) a PhD program. I put the following infographic together in order to lead people reading the thesis through the document. This inforgraphic outlines the original contribution of the thesis over the course of 5 sections, or articles, I have written. Two are published, one is slated for publication and the other two being finalised for submission.
The following graphic is large, please give it time to lead if you have a slow connection. Please click on it to see a larger version, or email me and I can send you a PDF.
Comments are welcome.